
206 lines
7.1 KiB
Markdown
Executable File
206 lines
7.1 KiB
Markdown
Executable File
---
|
|
comments: true
|
|
description: Learn about model deployment options in Ultralytics Platform including inference testing, dedicated endpoints, and monitoring dashboards.
|
|
keywords: Ultralytics Platform, deployment, inference, endpoints, monitoring, YOLO, production, cloud deployment
|
|
---
|
|
|
|
# Deployment
|
|
|
|
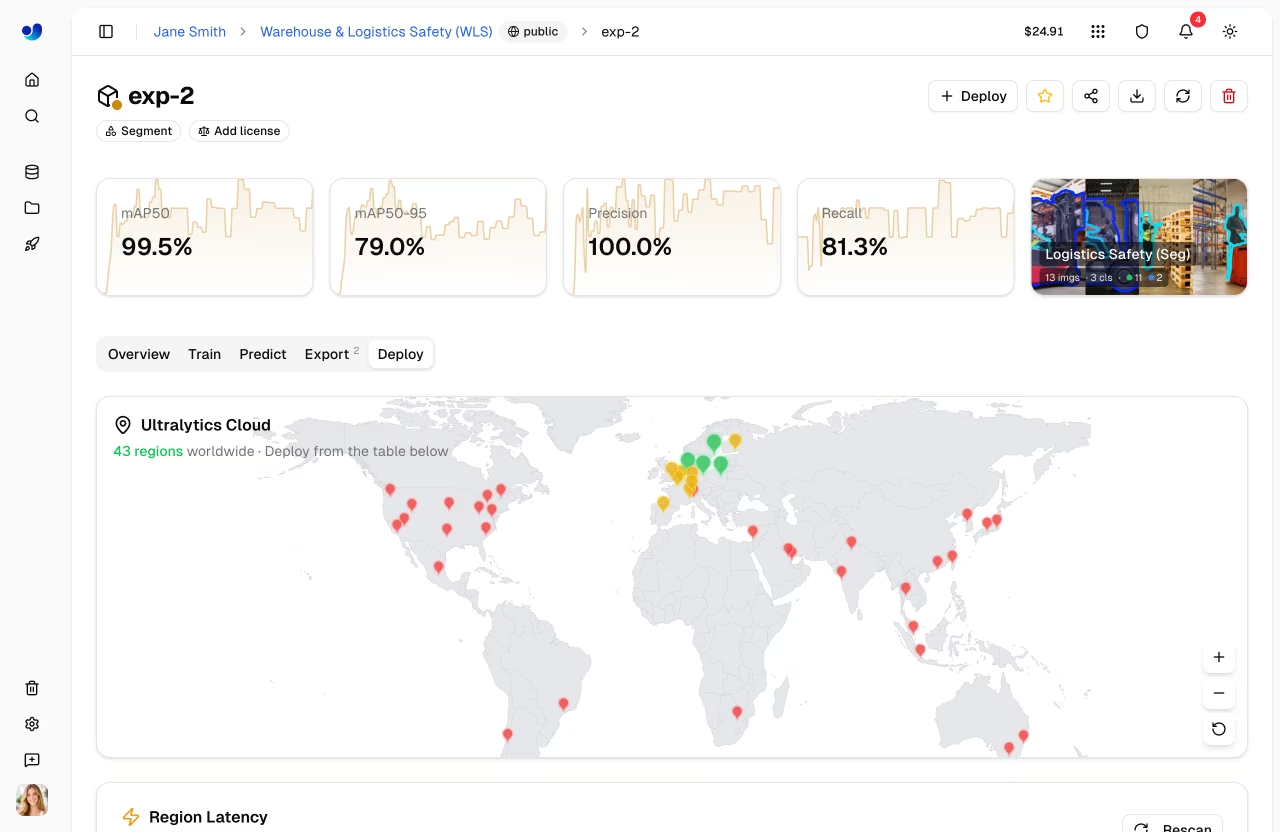
[Ultralytics Platform](https://platform.ultralytics.com) provides comprehensive deployment options for putting your YOLO models into production. Test models with browser-based inference, deploy to dedicated endpoints across 43 global regions, and monitor performance in real-time.
|
|
|
|
## Overview
|
|
|
|
The Deployment section helps you:
|
|
|
|
- **Test** models directly in the browser with the `Predict` tab
|
|
- **Deploy** to dedicated endpoints in 43 global regions
|
|
- **Monitor** request metrics, logs, and health checks
|
|
- **Scale** automatically with traffic (including scale-to-zero)
|
|
|
|
|
|
|
|
## Deployment Options
|
|
|
|
Ultralytics Platform offers multiple deployment paths:
|
|
|
|
| Option | Description | Best For |
|
|
| --------------------------------------- | -------------------------------------------------------- | ----------------------- |
|
|
| **[Predict Tab](inference.md)** | Browser-based inference with image, webcam, and examples | Development, validation |
|
|
| **Shared Inference** | Multi-tenant service across 3 regions | Light usage, testing |
|
|
| **[Dedicated Endpoints](endpoints.md)** | Single-tenant services across 43 regions | Production, low latency |
|
|
|
|
## Workflow
|
|
|
|
```mermaid
|
|
graph LR
|
|
A[✅ Test] --> B[⚙️ Configure]
|
|
B --> C[🌐 Deploy]
|
|
C --> D[📊 Monitor]
|
|
|
|
style A fill:#4CAF50,color:#fff
|
|
style B fill:#2196F3,color:#fff
|
|
style C fill:#FF9800,color:#fff
|
|
style D fill:#9C27B0,color:#fff
|
|
```
|
|
|
|
| Stage | Description |
|
|
| ------------- | ------------------------------------------------------------------------ |
|
|
| **Test** | Validate model with the [`Predict` tab](inference.md) |
|
|
| **Configure** | Select region, resources, and deployment name |
|
|
| **Deploy** | Create a dedicated endpoint from the [`Deploy` tab](endpoints.md) |
|
|
| **Monitor** | Track requests, latency, errors, and logs in [Monitoring](monitoring.md) |
|
|
|
|
## Architecture
|
|
|
|
### Shared Inference
|
|
|
|
The shared inference service runs in 3 key regions, automatically routing requests based on your data region:
|
|
|
|
```mermaid
|
|
graph TB
|
|
User[User Request] --> API[Platform API]
|
|
API --> Router{Region Router}
|
|
Router -->|US users| US["US Predict Service<br/>Iowa"]
|
|
Router -->|EU users| EU["EU Predict Service<br/>Belgium"]
|
|
Router -->|AP users| AP["AP Predict Service<br/>Hong Kong"]
|
|
|
|
style User fill:#f5f5f5,color:#333
|
|
style API fill:#2196F3,color:#fff
|
|
style Router fill:#FF9800,color:#fff
|
|
style US fill:#4CAF50,color:#fff
|
|
style EU fill:#4CAF50,color:#fff
|
|
style AP fill:#4CAF50,color:#fff
|
|
```
|
|
|
|
| Region | Location |
|
|
| ------ | ----------------------- |
|
|
| US | Iowa, USA |
|
|
| EU | Belgium, Europe |
|
|
| AP | Hong Kong, Asia-Pacific |
|
|
|
|
### Dedicated Endpoints
|
|
|
|
Deploy to 43 regions worldwide on Ultralytics Cloud:
|
|
|
|
- **Americas**: 14 regions
|
|
- **Europe**: 13 regions
|
|
- **Asia-Pacific**: 12 regions
|
|
- **Middle East & Africa**: 4 regions
|
|
|
|
Each endpoint is a single-tenant service with:
|
|
|
|
- Dedicated compute resources (configurable CPU and memory)
|
|
- Auto-scaling (scale-to-zero when idle)
|
|
- Unique endpoint URL
|
|
- Independent monitoring, logs, and health checks
|
|
|
|
## Deployments Page
|
|
|
|
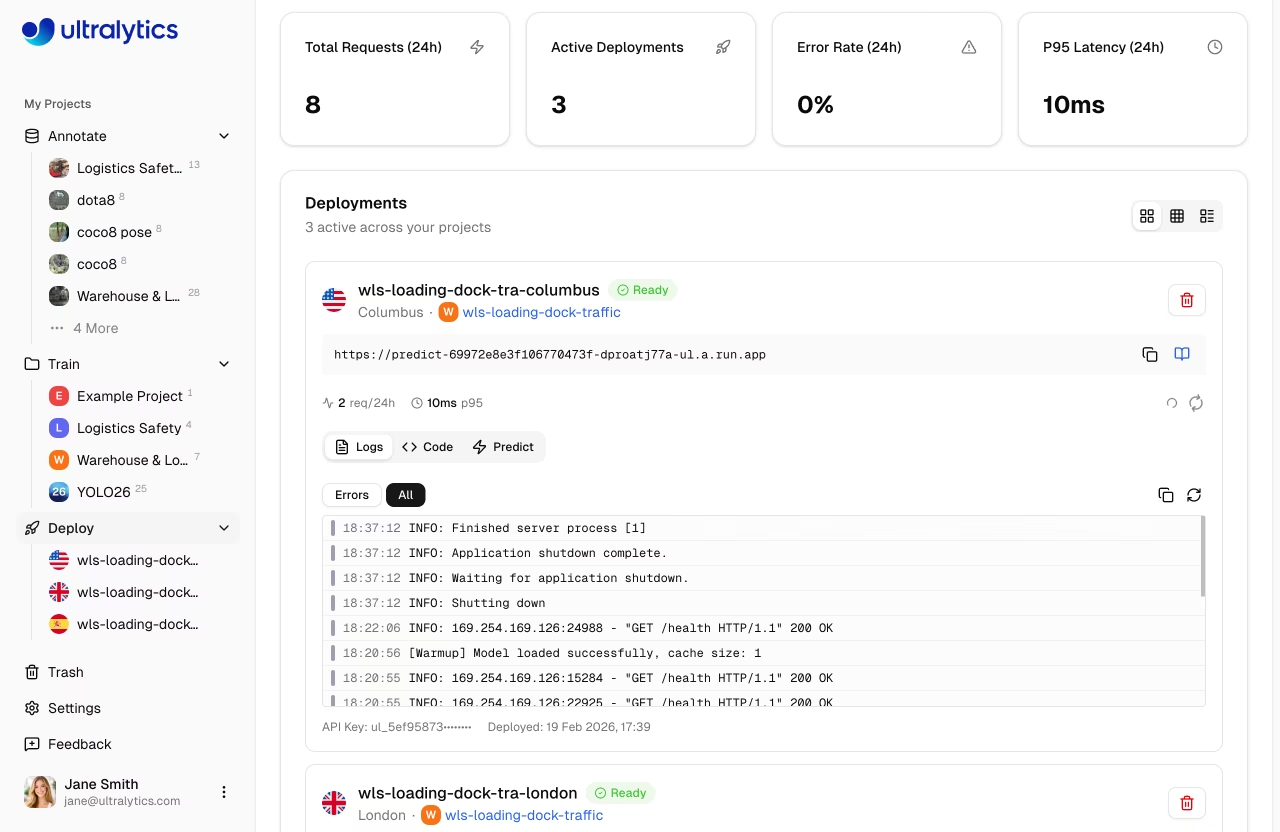
Access the global deployments page from the sidebar under `Deploy`. This page shows:
|
|
|
|
- **World map** with deployed region pins (interactive map)
|
|
- **Overview cards**: Total Requests (24h), Active Deployments, Error Rate (24h), P95 Latency (24h)
|
|
- **Deployments list** with three view modes: cards, compact, and table
|
|
- **New Deployment** button to create endpoints from any completed model
|
|
|
|
|
|
|
|
!!! info "Automatic Polling"
|
|
|
|
The page polls every 30 seconds for metric updates. When deployments are in a transitional state (creating, deploying, stopping), polling increases to every 2-3 seconds for near-instant feedback.
|
|
|
|
## Key Features
|
|
|
|
### Global Coverage
|
|
|
|
Deploy close to your users with 43 regions covering:
|
|
|
|
- North America, South America
|
|
- Europe, Middle East, Africa
|
|
- Asia Pacific, Oceania
|
|
|
|
### Auto-Scaling
|
|
|
|
Endpoints scale automatically:
|
|
|
|
- **Scale to zero**: No cost when idle (default)
|
|
- **Scale up**: Handle traffic spikes automatically
|
|
|
|
!!! tip "Cost Savings"
|
|
|
|
Scale-to-zero is enabled by default (min instances = 0). You only pay for active inference time.
|
|
|
|
### Low Latency
|
|
|
|
Dedicated endpoints provide:
|
|
|
|
- Cold start: ~5-15 seconds (cached container), up to ~45 seconds (first deploy)
|
|
- Warm inference: 50-200ms (model dependent)
|
|
- Regional routing for optimal performance
|
|
|
|
### Health Checks
|
|
|
|
Each running deployment includes an automatic health check with:
|
|
|
|
- Live status indicator (healthy/unhealthy)
|
|
- Response latency display
|
|
- Auto-retry when unhealthy (polls every 20 seconds)
|
|
- Manual refresh button
|
|
|
|
## Quick Start
|
|
|
|
Deploy a model in under 2 minutes:
|
|
|
|
1. Train or upload a model to a project
|
|
2. Go to the model's **Deploy** tab
|
|
3. Select a region from the latency table
|
|
4. Click **Deploy** — your endpoint is live
|
|
|
|
!!! example "Quick Deploy"
|
|
|
|
```
|
|
Model → Deploy tab → Select region → Click Deploy → Endpoint URL ready
|
|
```
|
|
|
|
Once deployed, use the endpoint URL with your API key to send inference requests from any application.
|
|
|
|
## Quick Links
|
|
|
|
- [**Inference**](inference.md): Test models in browser
|
|
- [**Endpoints**](endpoints.md): Deploy dedicated endpoints
|
|
- [**Monitoring**](monitoring.md): Track deployment performance
|
|
|
|
## FAQ
|
|
|
|
### What's the difference between shared and dedicated inference?
|
|
|
|
| Feature | Shared | Dedicated |
|
|
| ----------- | --------------- | -------------- |
|
|
| **Latency** | Variable | Consistent |
|
|
| **Cost** | Pay per request | Pay for uptime |
|
|
| **Scale** | Limited | Configurable |
|
|
| **Regions** | 3 | 43 |
|
|
| **URL** | Generic | Custom |
|
|
|
|
### How long does deployment take?
|
|
|
|
Dedicated endpoint deployment typically takes 1-2 minutes:
|
|
|
|
1. Image pull (~30s)
|
|
2. Container start (~30s)
|
|
3. Health check (~30s)
|
|
|
|
### Can I deploy multiple models?
|
|
|
|
Yes, each model can have multiple endpoints in different regions. There's no limit on total endpoints (subject to your plan).
|
|
|
|
### What happens when an endpoint is idle?
|
|
|
|
With scale-to-zero enabled:
|
|
|
|
- Endpoint scales down after inactivity
|
|
- First request triggers cold start
|
|
- Subsequent requests are fast
|
|
|
|
First requests after an idle period trigger a cold start.
|