278 lines
13 KiB
Markdown
278 lines
13 KiB
Markdown

|
---
|
||
|
|
comments: true
|
||
|
|
description: Dive into advanced data exploration with Ultralytics Explorer. Perform semantic searches, execute SQL queries, and leverage AI-powered natural language insights for seamless data analysis.
|
||
|
|
keywords: Ultralytics Explorer, data exploration, semantic search, vector similarity, SQL queries, AI, natural language queries, machine learning, OpenAI, LLMs, Ultralytics Platform
|
||
|
|
---
|
||
|
|
|
||
|
|
# VOC Exploration Example
|
||
|
|
|
||
|
|
<div align="center">
|
||
|
|
|
||
|
|
<a href="https://www.ultralytics.com/events/yolovision" target="_blank"><img width="100%" src="https://cdn.jsdelivr.net/gh/ultralytics/assets@main/docs/ultralytics-yolov8-banner.avif" alt="Ultralytics YOLO banner"></a>
|
||
|
|
<a href="https://docs.ultralytics.com/zh/">中文</a> |
|
||
|
|
<a href="https://docs.ultralytics.com/ko/">한국어</a> |
|
||
|
|
<a href="https://docs.ultralytics.com/ja/">日本語</a> |
|
||
|
|
<a href="https://docs.ultralytics.com/ru/">Русский</a> |
|
||
|
|
<a href="https://docs.ultralytics.com/de/">Deutsch</a> |
|
||
|
|
<a href="https://docs.ultralytics.com/fr/">Français</a> |
|
||
|
|
<a href="https://docs.ultralytics.com/es">Español</a> |
|
||
|
|
<a href="https://docs.ultralytics.com/pt/">Português</a> |
|
||
|
|
<a href="https://docs.ultralytics.com/tr/">Türkçe</a> |
|
||
|
|
<a href="https://docs.ultralytics.com/vi/">Tiếng Việt</a> |
|
||
|
|
<a href="https://docs.ultralytics.com/ar/">العربية</a>
|
||
|
|
<br>
|
||
|
|
|
||
|
|
<br>
|
||
|
|
<a href="https://github.com/ultralytics/ultralytics/actions/workflows/ci.yml"><img src="https://github.com/ultralytics/ultralytics/actions/workflows/ci.yml/badge.svg" alt="Ultralytics CI"></a>
|
||
|
|
<a href="https://clickpy.clickhouse.com/dashboard/ultralytics"><img src="https://static.pepy.tech/badge/ultralytics" alt="Ultralytics Downloads"></a>
|
||
|
|
<a href="https://zenodo.org/badge/latestdoi/264818686"><img src="https://zenodo.org/badge/264818686.svg" alt="Ultralytics YOLO Citation"></a>
|
||
|
|
<a href="https://discord.com/invite/ultralytics"><img alt="Ultralytics Discord" src="https://img.shields.io/discord/1089800235347353640?logo=discord&logoColor=white&label=Discord&color=blue"></a>
|
||
|
|
<a href="https://community.ultralytics.com/"><img alt="Ultralytics Forums" src="https://img.shields.io/discourse/users?server=https%3A%2F%2Fcommunity.ultralytics.com&logo=discourse&label=Forums&color=blue"></a>
|
||
|
|
<a href="https://www.reddit.com/r/ultralytics/"><img alt="Ultralytics Reddit" src="https://img.shields.io/reddit/subreddit-subscribers/ultralytics?style=flat&logo=reddit&logoColor=white&label=Reddit&color=blue"></a>
|
||
|
|
<br>
|
||
|
|
<a href="https://console.paperspace.com/github/ultralytics/ultralytics"><img src="https://assets.paperspace.io/img/gradient-badge.svg" alt="Run Ultralytics on Gradient"></a>
|
||
|
|
<a href="https://colab.research.google.com/github/ultralytics/ultralytics/blob/main/examples/tutorial.ipynb"><img src="https://colab.research.google.com/assets/colab-badge.svg" alt="Open Ultralytics In Colab"></a>
|
||
|
|
<a href="https://www.kaggle.com/models/ultralytics/yolo26"><img src="https://kaggle.com/static/images/open-in-kaggle.svg" alt="Open Ultralytics In Kaggle"></a>
|
||
|
|
<a href="https://mybinder.org/v2/gh/ultralytics/ultralytics/HEAD?labpath=examples%2Ftutorial.ipynb"><img src="https://mybinder.org/badge_logo.svg" alt="Open Ultralytics In Binder"></a>
|
||
|
|
<br>
|
||
|
|
</div>
|
||
|
|
|
||
|
|
Welcome to the Ultralytics Explorer API notebook. This notebook introduces the resources available for exploring datasets with semantic search, vector search, and SQL queries.
|
||
|
|
|
||
|
|
Try `yolo explorer` (powered by the Explorer API)
|
||
|
|
|
||
|
|
Install `ultralytics` and run `yolo explorer` in your terminal to run custom queries and semantic search in your browser.
|
||
|
|
|
||
|
|
!!! warning "Community Note ⚠️"
|
||
|
|
|
||
|
|
As of **`ultralytics>=8.3.10`**, Ultralytics Explorer support is deprecated. Similar (and expanded) dataset exploration features are available in [Ultralytics Platform](https://platform.ultralytics.com/).
|
||
|
|
|
||
|
|
## Setup
|
||
|
|
|
||
|
|
Install `ultralytics` and the required [dependencies](https://github.com/ultralytics/ultralytics/blob/main/pyproject.toml), then check software and hardware.
|
||
|
|
|
||
|
|
```bash
|
||
|
|
!uv pip install ultralytics[explorer] openai
|
||
|
|
yolo checks
|
||
|
|
```
|
||
|
|
|
||
|
|
## Similarity Search
|
||
|
|
|
||
|
|
Utilize the power of vector similarity search to find the similar data points in your dataset along with their distance in the embedding space. Simply create an embeddings table for the given dataset-model pair. It is only needed once, and it is reused automatically.
|
||
|
|
|
||
|
|
```python
|
||
|
|
exp = Explorer("VOC.yaml", model="yolo26n.pt")
|
||
|
|
exp.create_embeddings_table()
|
||
|
|
```
|
||
|
|
|
||
|
|
Once the embeddings table is built, you can run semantic search in any of the following ways:
|
||
|
|
|
||
|
|
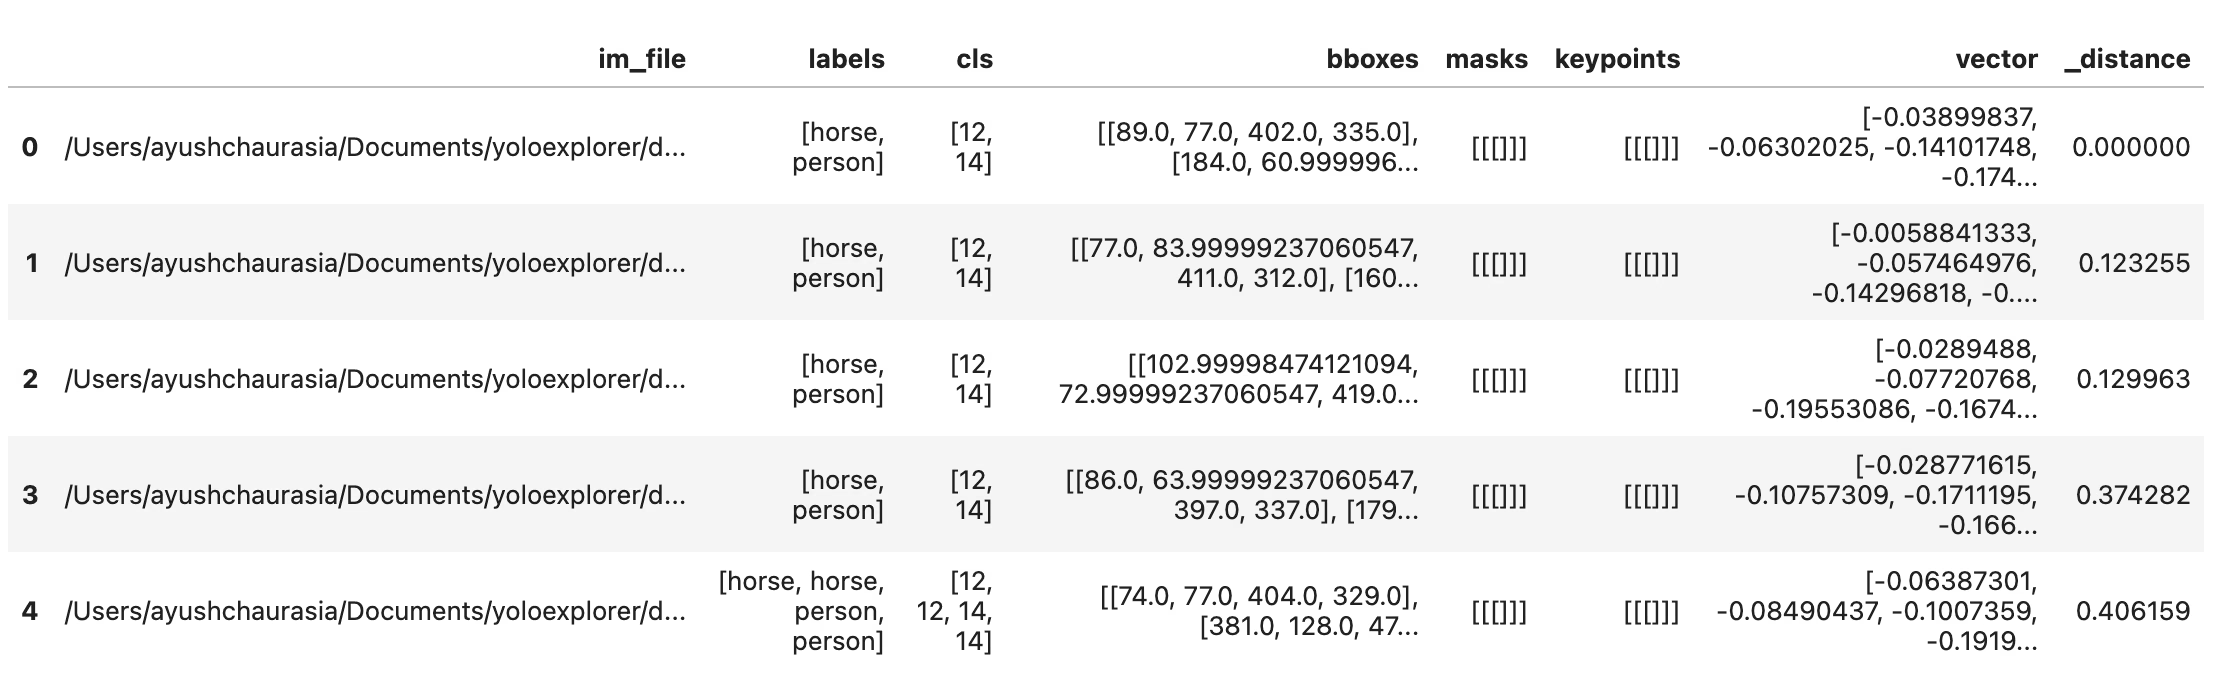
- On a given index/list of indices in the dataset, e.g., `exp.get_similar(idx=[1, 10], limit=10)`
|
||
|
|
- On any image/ list of images not in the dataset - exp.get_similar(img=["path/to/img1", "path/to/img2"], limit=10) In case of multiple inputs, the aggregate of their embeddings is used.
|
||
|
|
|
||
|
|
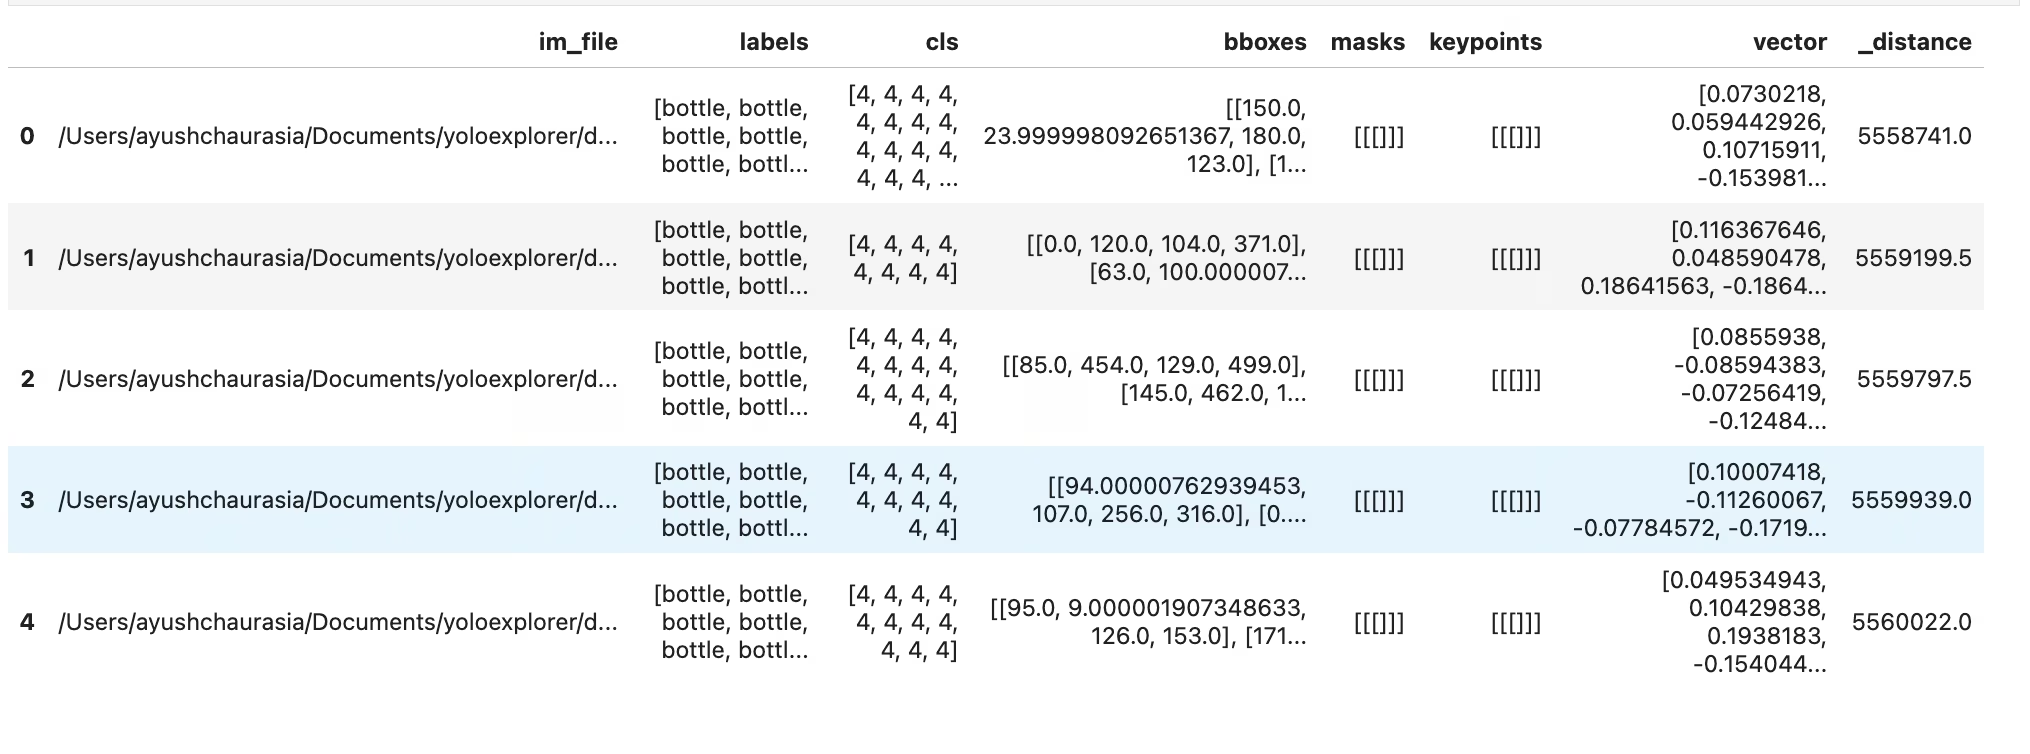
You get a pandas DataFrame with the limit number of most similar data points to the input, along with their distance in the embedding space. You can use this dataset to perform further filtering.
|
||
|
|
|
||
|
|
|
||
|
|
|
||
|
|
```python
|
||
|
|
# Search dataset by index
|
||
|
|
similar = exp.get_similar(idx=1, limit=10)
|
||
|
|
similar.head()
|
||
|
|
```
|
||
|
|
|
||
|
|
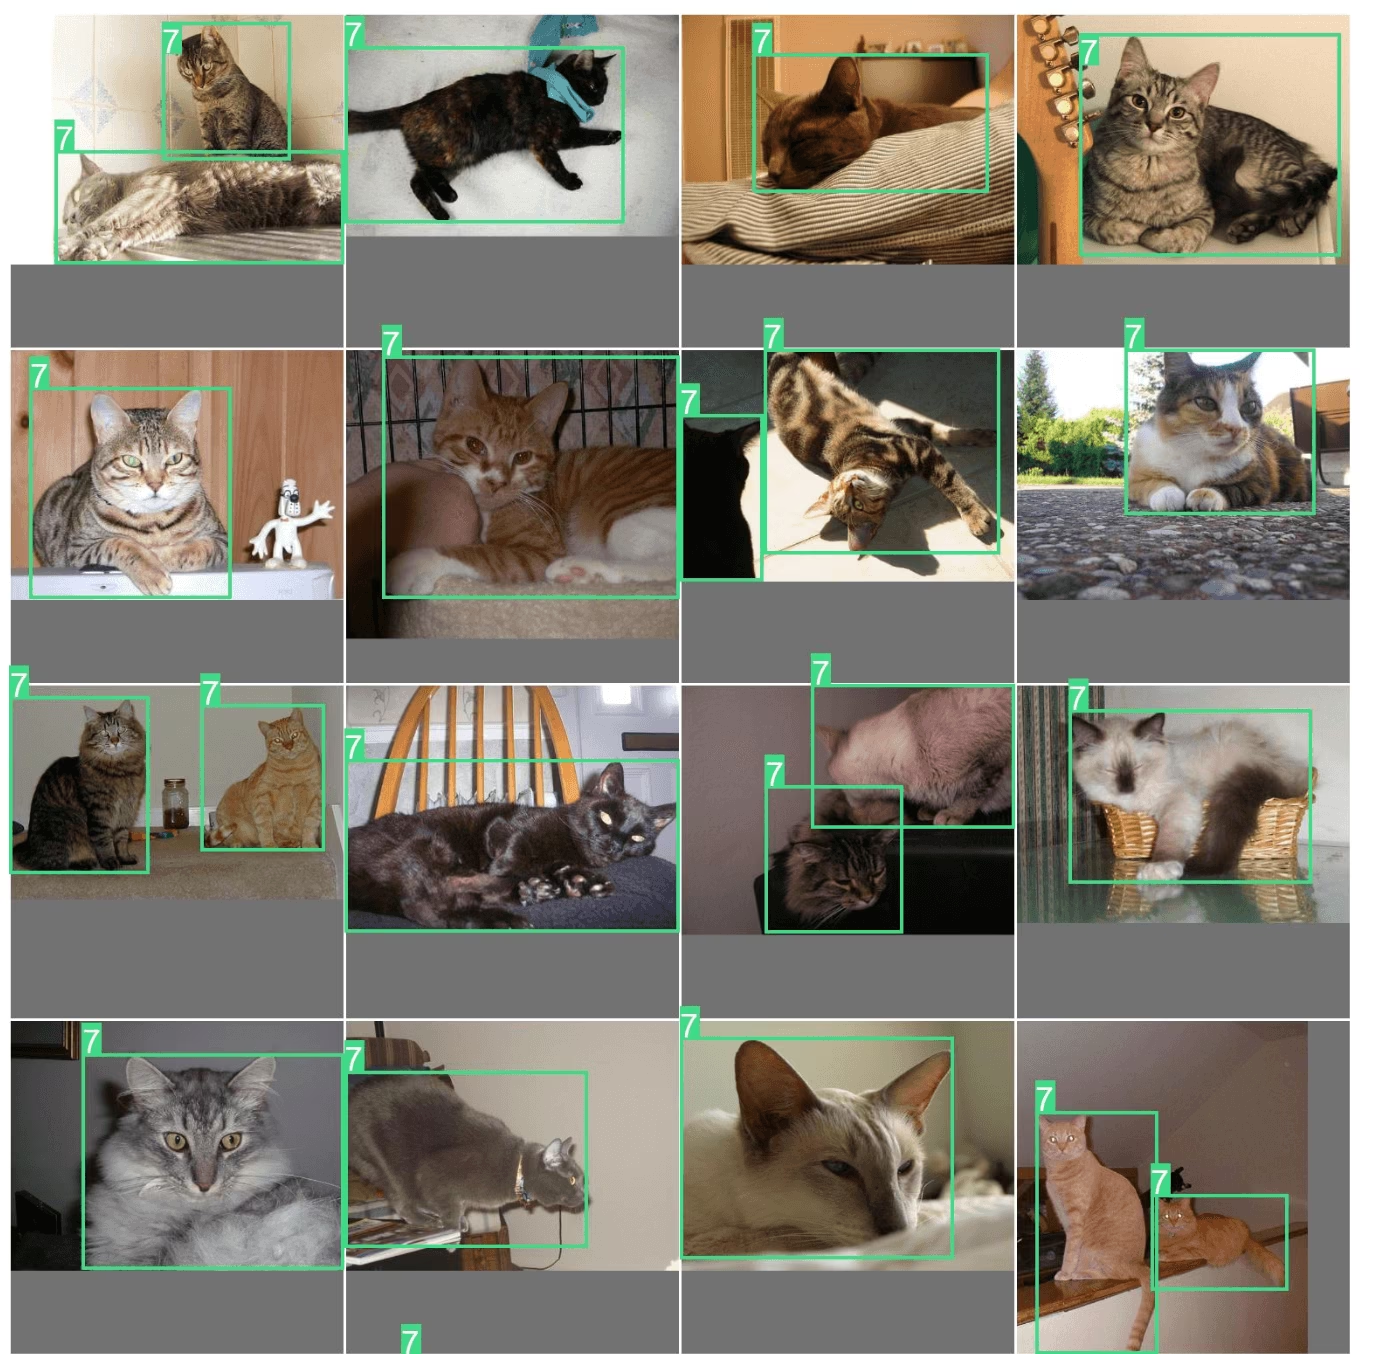
You can also plot the similar samples directly using the `plot_similar` util
|
||
|
|
|
||
|
|
|
||
|
|
|
||
|
|
```python
|
||
|
|
exp.plot_similar(idx=6500, limit=20)
|
||
|
|
exp.plot_similar(idx=[100, 101], limit=10) # Can also pass list of idxs or imgs
|
||
|
|
|
||
|
|
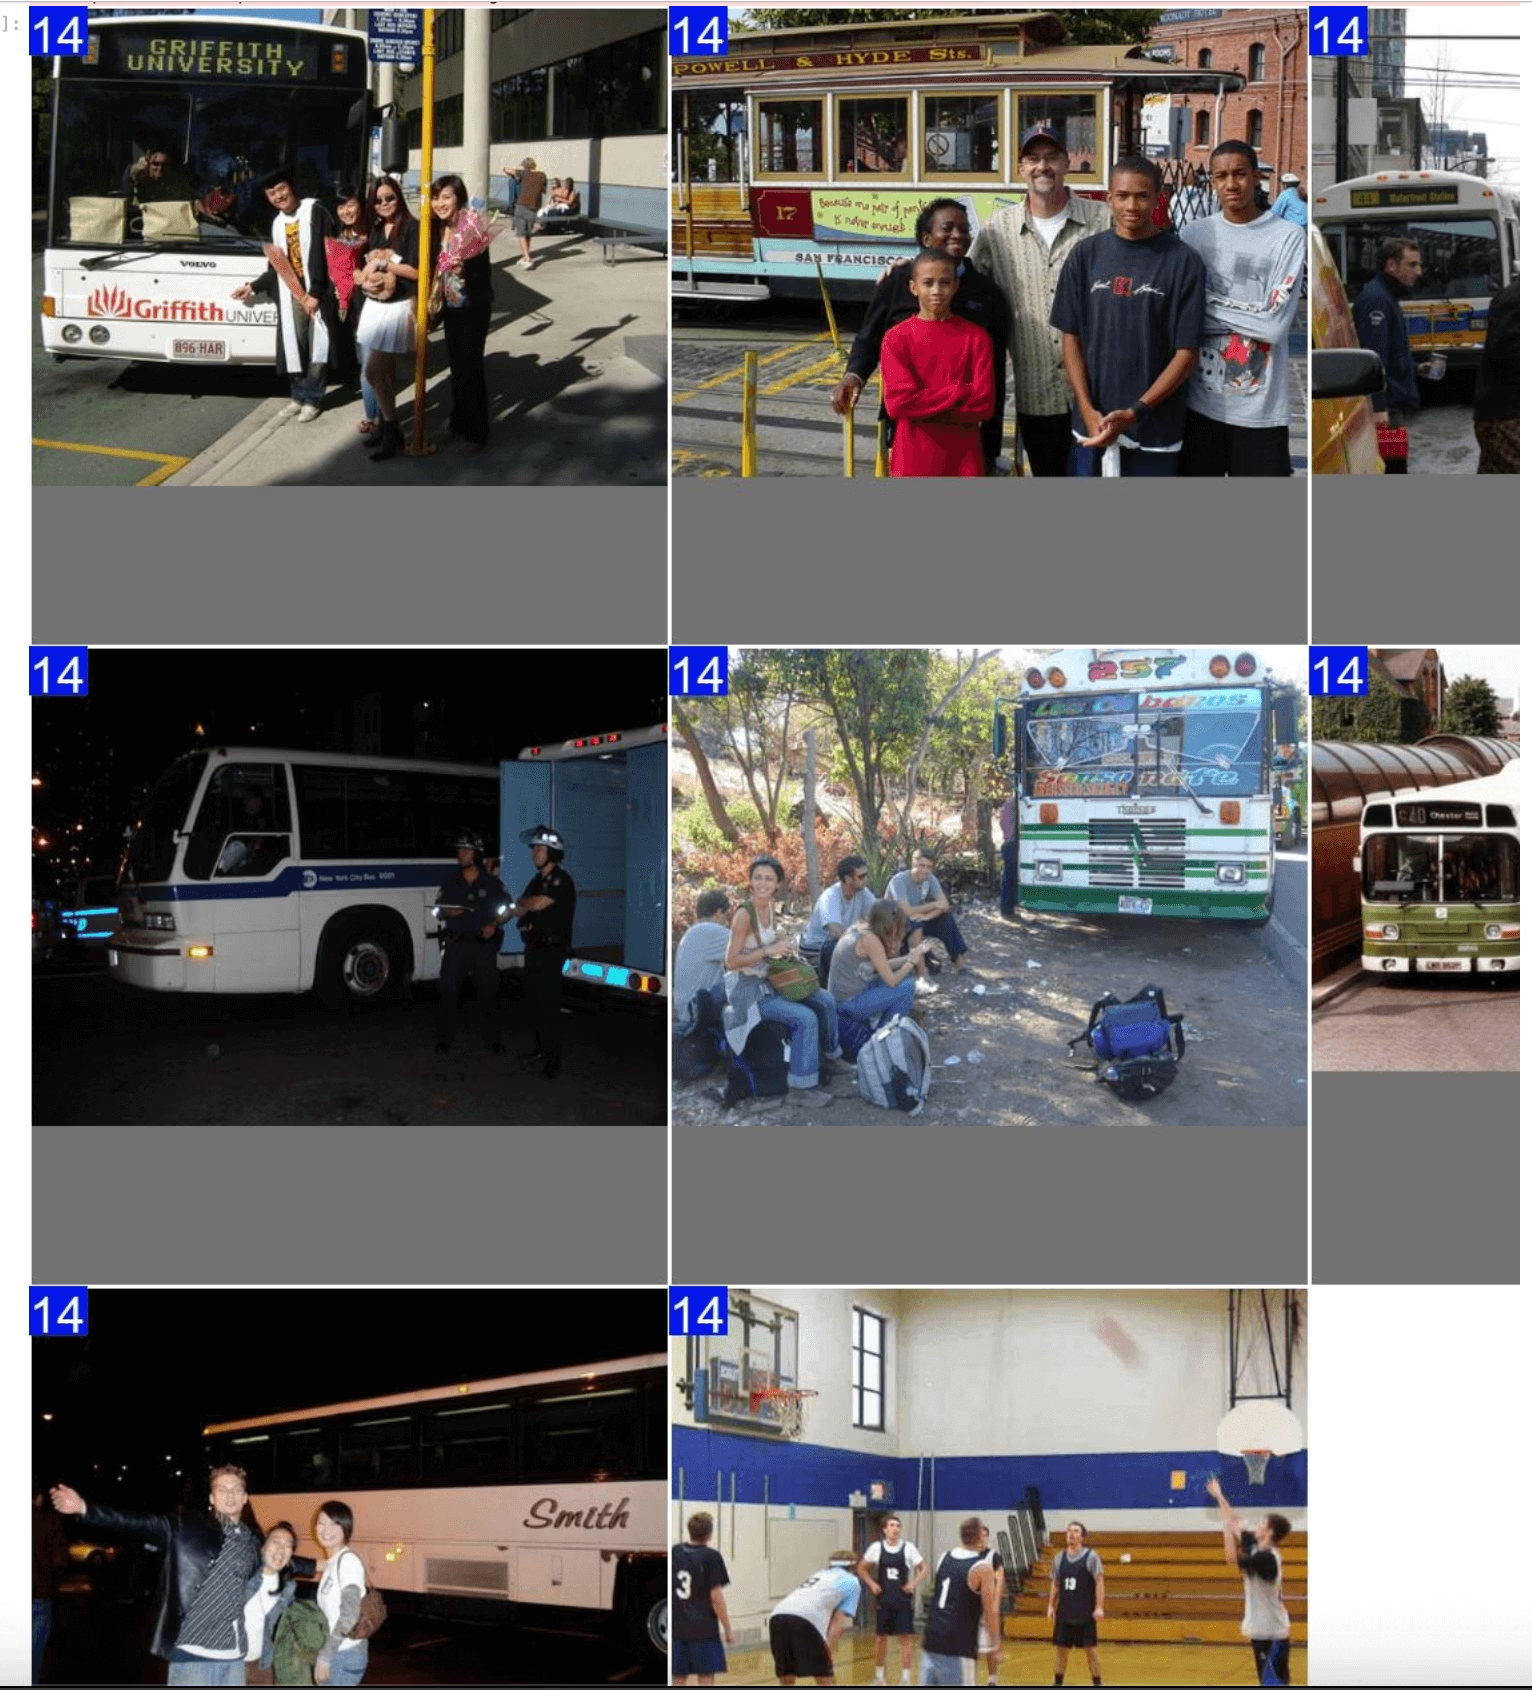
exp.plot_similar(img="https://ultralytics.com/images/bus.jpg", limit=10, labels=False) # Can also pass external images
|
||
|
|
```
|
||
|
|
|
||
|
|
|
||
|
|
|
||
|
|
## Ask AI: Search or Filter with Natural Language
|
||
|
|
|
||
|
|
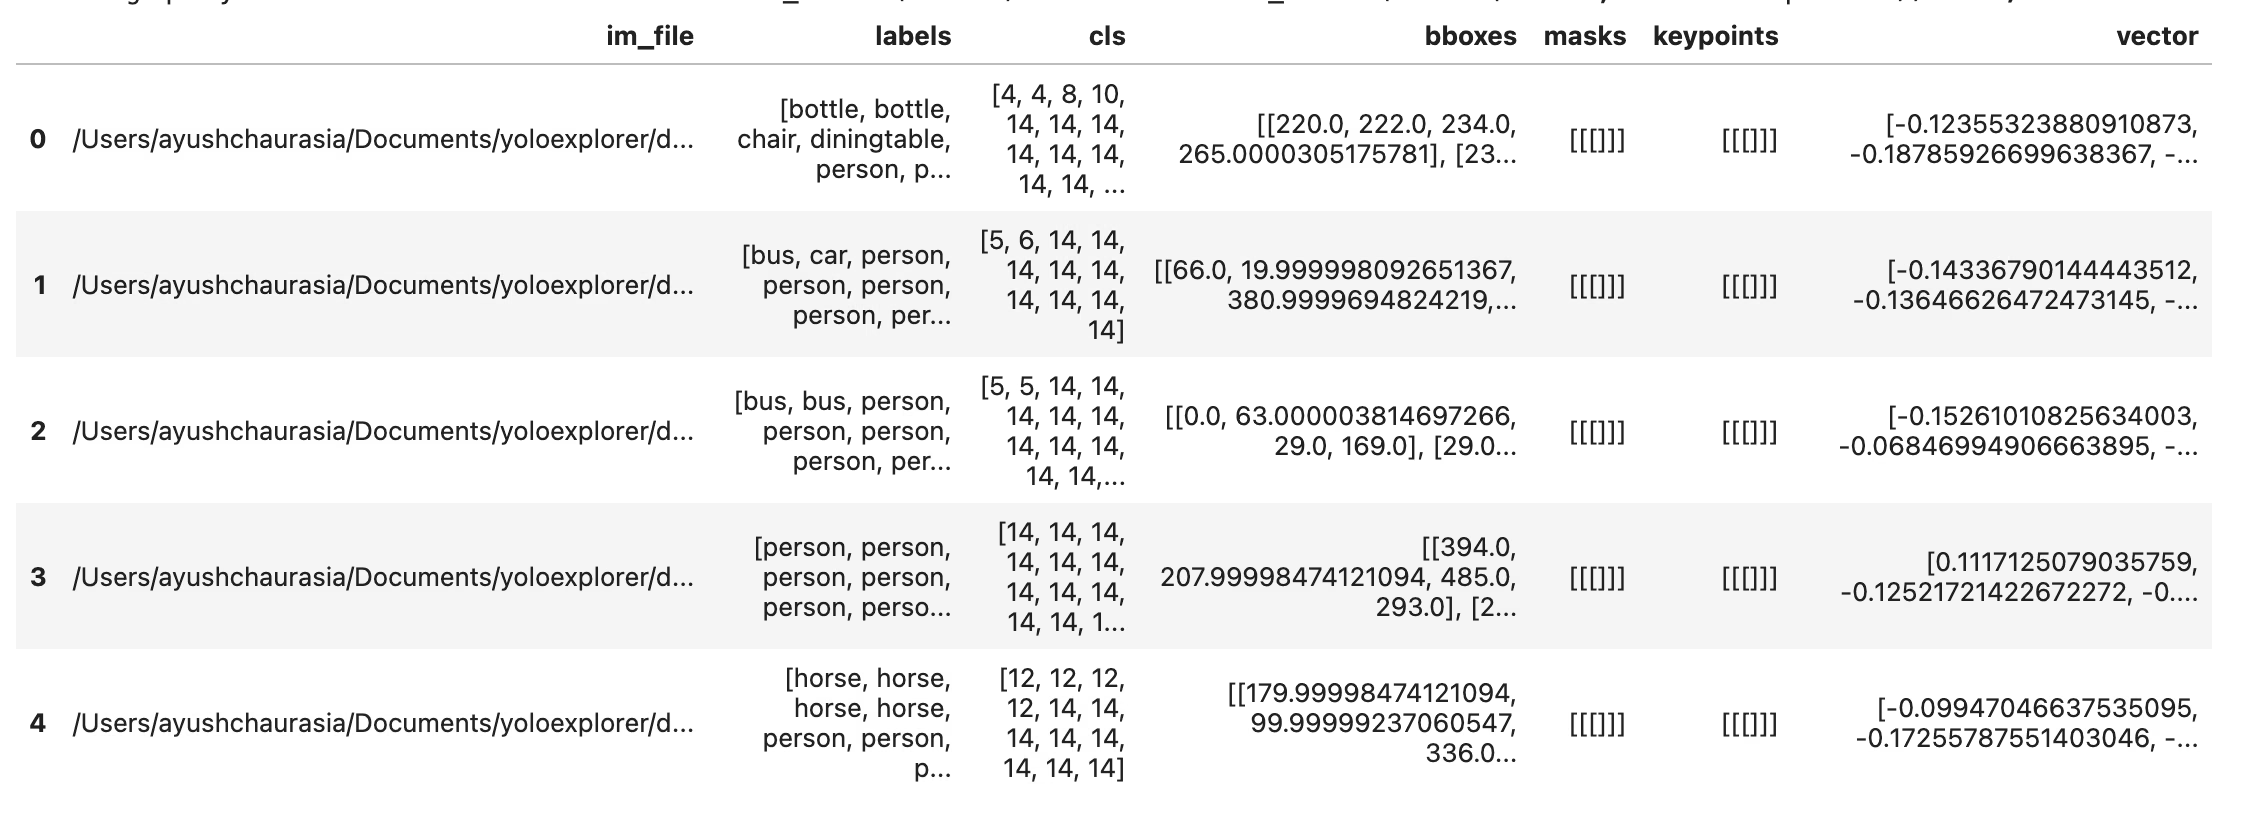
You can prompt the Explorer object with the kind of data points you want to see, and it will try to return a DataFrame with those results. Because it is powered by LLMs, it does not always get it right. In that case, it will return `None`.
|
||
|
|
|
||
|
|
|
||
|
|
|
||
|
|
```python
|
||
|
|
df = exp.ask_ai("show me images containing more than 10 objects with at least 2 persons")
|
||
|
|
df.head(5)
|
||
|
|
```
|
||
|
|
|
||
|
|
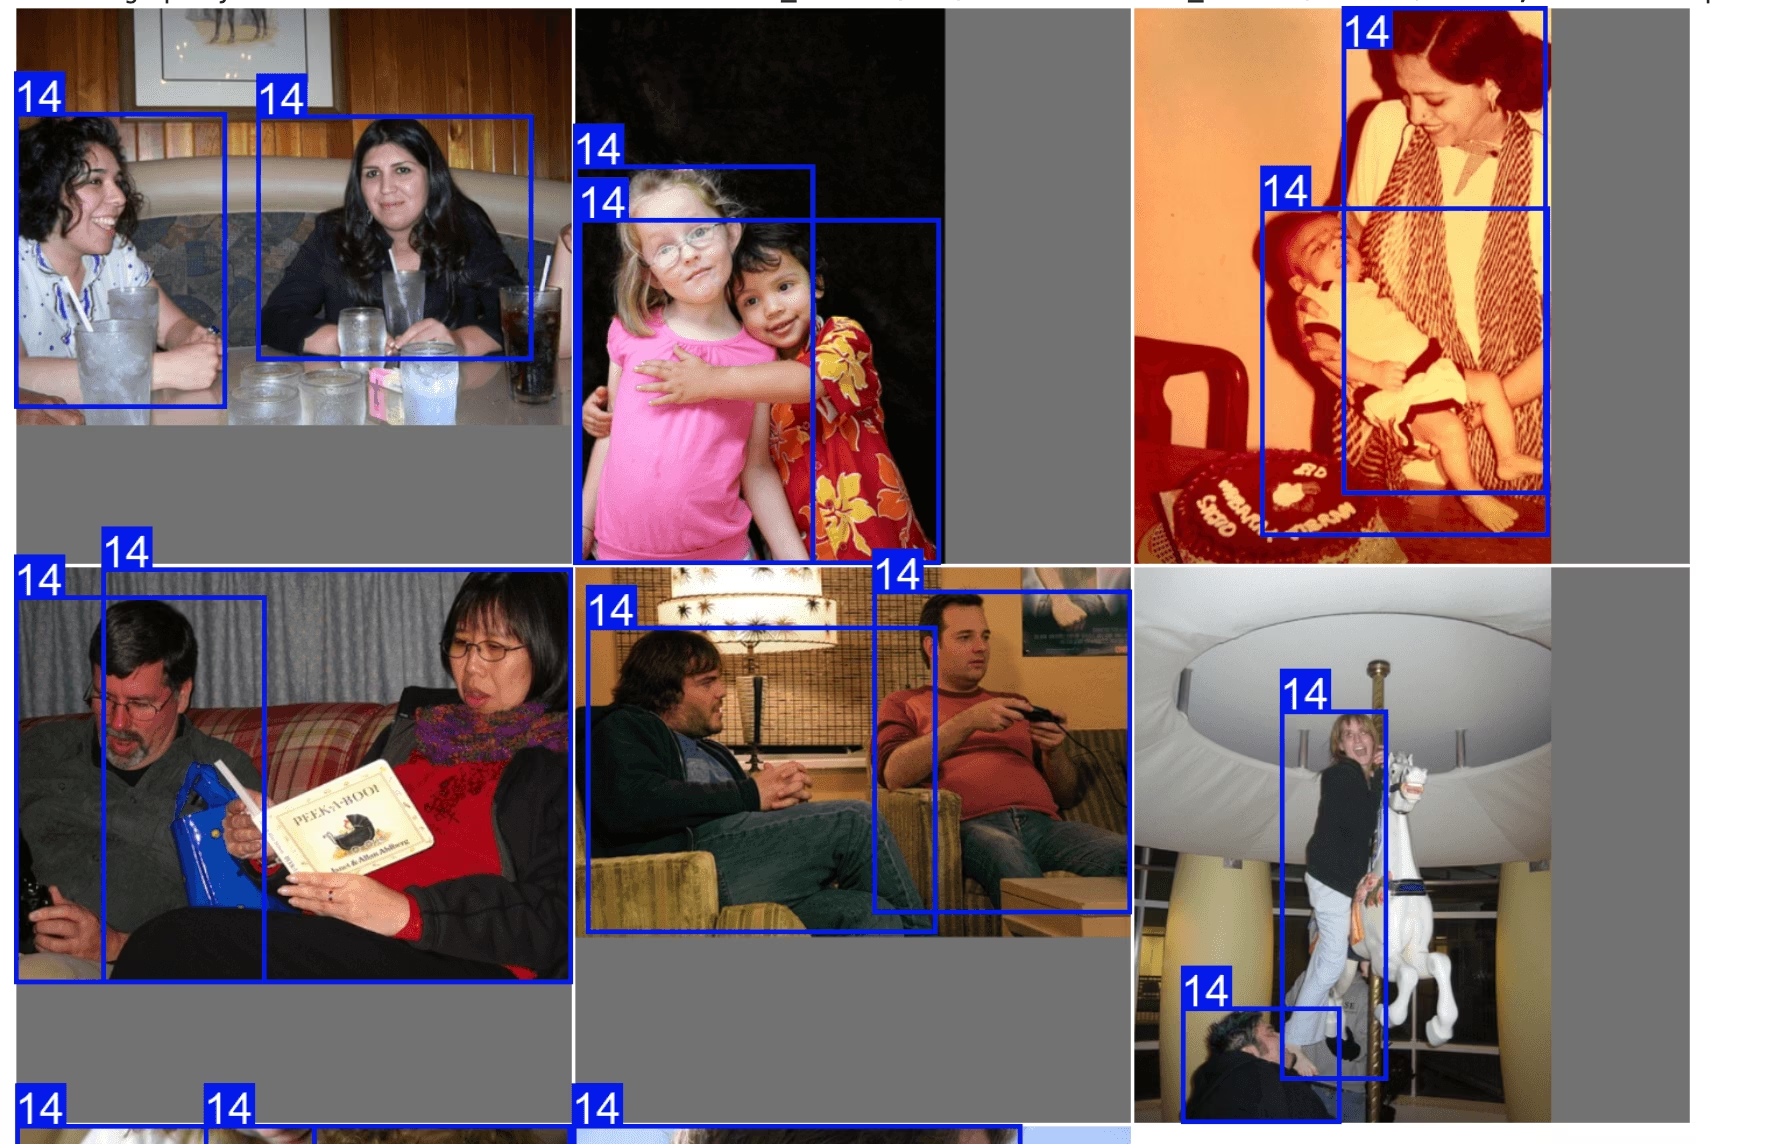
To plot these results, you can use the `plot_query_result` utility. Example:
|
||
|
|
|
||
|
|
```python
|
||
|
|
plt = plot_query_result(exp.ask_ai("show me 10 images containing exactly 2 persons"))
|
||
|
|
Image.fromarray(plt)
|
||
|
|
```
|
||
|
|
|
||
|
|
|
||
|
|
|
||
|
|
```python
|
||
|
|
# plot
|
||
|
|
from PIL import Image
|
||
|
|
from ultralytics.data.explorer import plot_query_result
|
||
|
|
|
||
|
|
plt = plot_query_result(exp.ask_ai("show me 10 images containing exactly 2 persons"))
|
||
|
|
Image.fromarray(plt)
|
||
|
|
```
|
||
|
|
|
||
|
|
## Run SQL Queries on Your Dataset
|
||
|
|
|
||
|
|
Sometimes you might want to investigate certain entries in your dataset. For this, Explorer allows you to execute SQL queries. It accepts either of the following formats:
|
||
|
|
|
||
|
|
- Queries beginning with "WHERE" will automatically select all columns. This can be thought of as a shorthand query.
|
||
|
|
- You can also write full queries where you can specify which columns to select.
|
||
|
|
|
||
|
|
This can be used to investigate model performance and specific data points. For example:
|
||
|
|
|
||
|
|
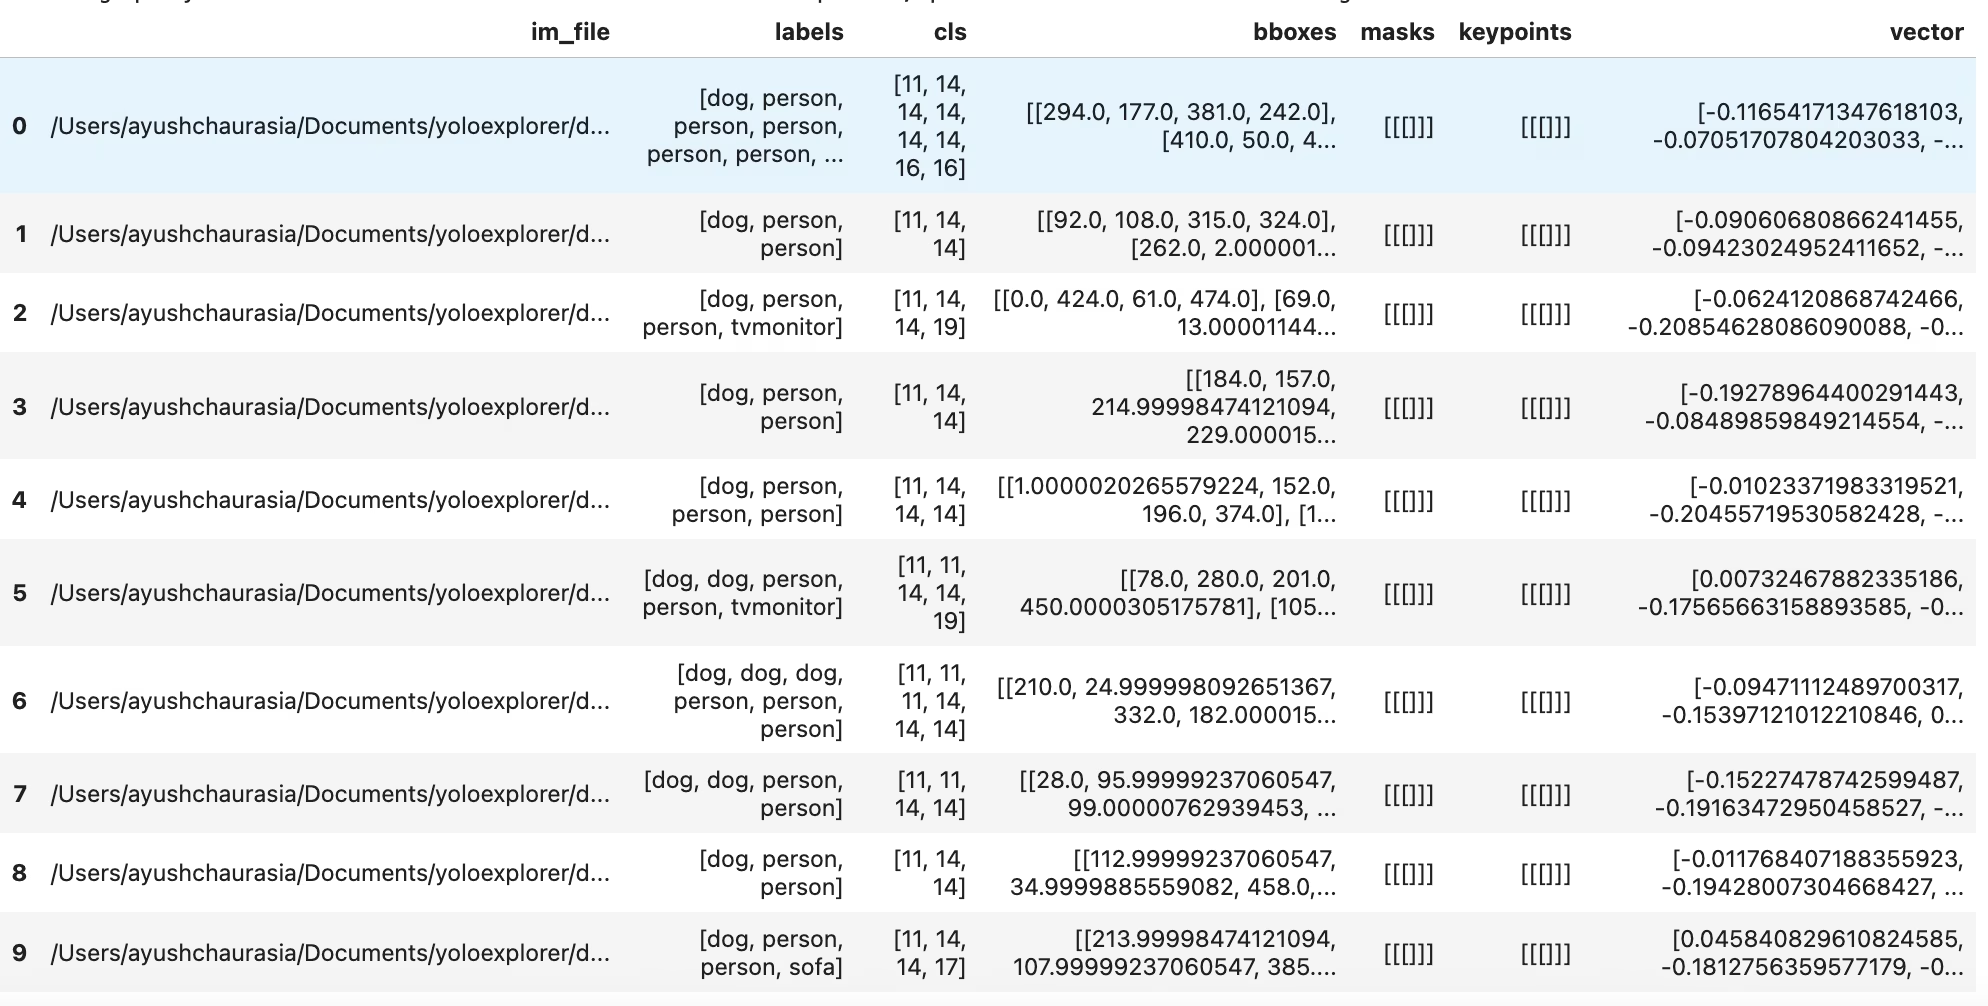
- let's say your model struggles on images that have humans and dogs. You can write a query like this to select the points that have at least 2 humans AND at least one dog.
|
||
|
|
|
||
|
|
You can combine SQL query and semantic search to filter down to specific type of results
|
||
|
|
|
||
|
|
```python
|
||
|
|
table = exp.sql_query("WHERE labels LIKE '%person, person%' AND labels LIKE '%dog%' LIMIT 10")
|
||
|
|
exp.plot_sql_query("WHERE labels LIKE '%person, person%' AND labels LIKE '%dog%' LIMIT 10", labels=True)
|
||
|
|
```
|
||
|
|
|
||
|
|
|
||
|
|
|
||
|
|
```python
|
||
|
|
table = exp.sql_query("WHERE labels LIKE '%person, person%' AND labels LIKE '%dog%' LIMIT 10")
|
||
|
|
print(table)
|
||
|
|
```
|
||
|
|
|
||
|
|
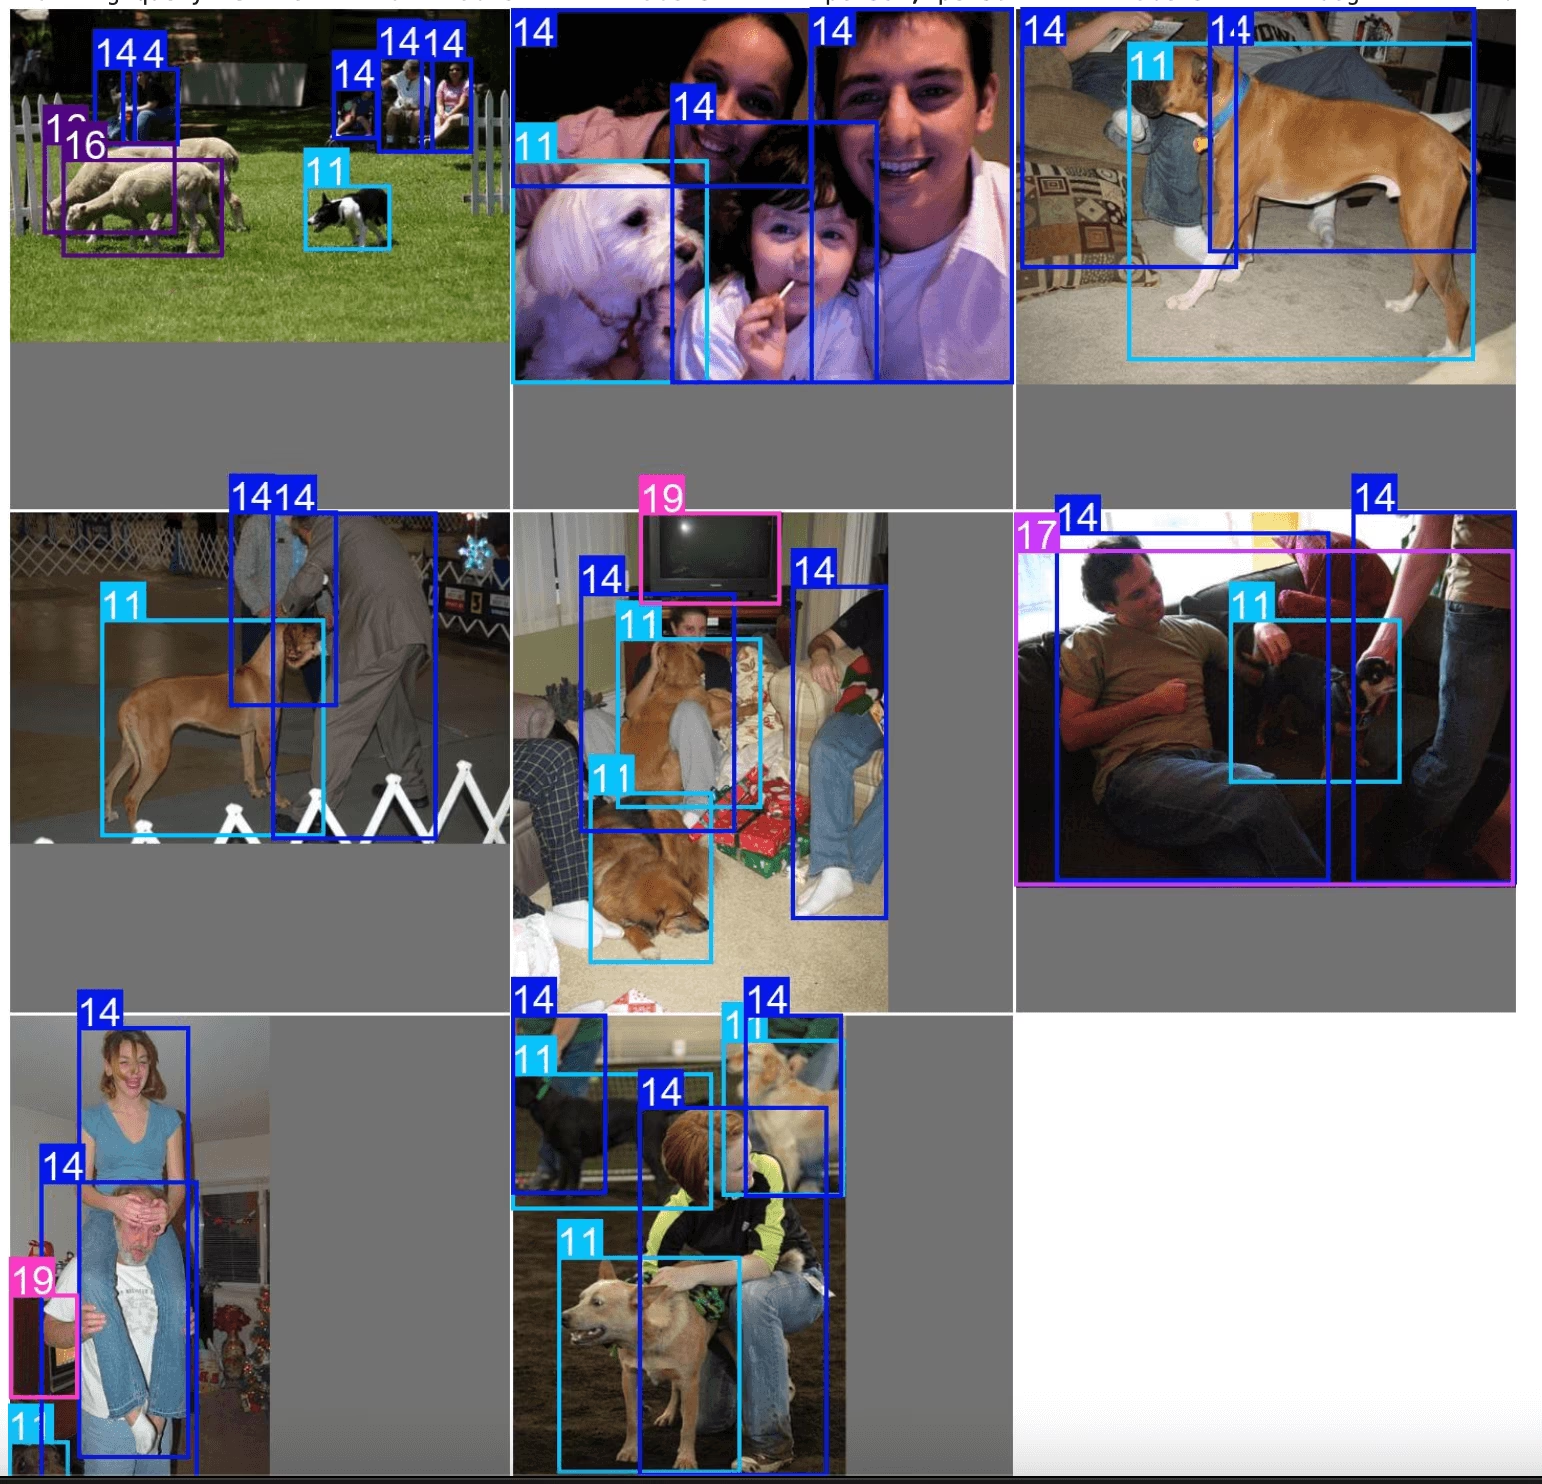
Just like similarity search, you also get a util to directly plot the sql queries using `exp.plot_sql_query`
|
||
|
|
|
||
|
|
|
||
|
|
|
||
|
|
```python
|
||
|
|
exp.plot_sql_query("WHERE labels LIKE '%person, person%' AND labels LIKE '%dog%' LIMIT 10", labels=True)
|
||
|
|
```
|
||
|
|
|
||
|
|
## Working with embeddings Table (Advanced)
|
||
|
|
|
||
|
|
Explorer works on [LanceDB](https://lancedb.github.io/lancedb/) tables internally. You can access this table directly, using `Explorer.table` object and run raw queries, push down pre- and post-filters, etc.
|
||
|
|
|
||
|
|
```python
|
||
|
|
table = exp.table
|
||
|
|
print(table.schema)
|
||
|
|
```
|
||
|
|
|
||
|
|
### Run raw queries
|
||
|
|
|
||
|
|
Vector Search finds the nearest vectors from the database. In a recommendation system or search engine, you can find similar products from the one you searched. In LLM and other AI applications, each data point can be presented by the embeddings generated from some models, it returns the most relevant features.
|
||
|
|
|
||
|
|
A search in high-dimensional vector space, is to find K-Nearest-Neighbors (KNN) of the query vector.
|
||
|
|
|
||
|
|
Metric In LanceDB, a Metric is the way to describe the distance between a pair of vectors. Currently, it supports the following metrics:
|
||
|
|
|
||
|
|
- L2
|
||
|
|
- Cosine
|
||
|
|
- Dot Explorer's similarity search uses L2 by default. You can run queries on tables directly, or use the lance format to build custom utilities to manage datasets. More details on available LanceDB table ops in the [docs](https://lancedb.github.io/lancedb/)
|
||
|
|
|
||
|
|
|
||
|
|
|
||
|
|
```python
|
||
|
|
dummy_img_embedding = [i for i in range(256)]
|
||
|
|
table.search(dummy_img_embedding).limit(5).to_pandas()
|
||
|
|
```
|
||
|
|
|
||
|
|
### Interconversion to popular data formats
|
||
|
|
|
||
|
|
```python
|
||
|
|
df = table.to_pandas()
|
||
|
|
pa_table = table.to_arrow()
|
||
|
|
```
|
||
|
|
|
||
|
|
### Work with Embeddings
|
||
|
|
|
||
|
|
You can access the raw embedding from lancedb Table and analyze it. The image embeddings are stored in column `vector`
|
||
|
|
|
||
|
|
```python
|
||
|
|
import numpy as np
|
||
|
|
|
||
|
|
embeddings = table.to_pandas()["vector"].tolist()
|
||
|
|
embeddings = np.array(embeddings)
|
||
|
|
```
|
||
|
|
|
||
|
|
### Scatterplot
|
||
|
|
|
||
|
|
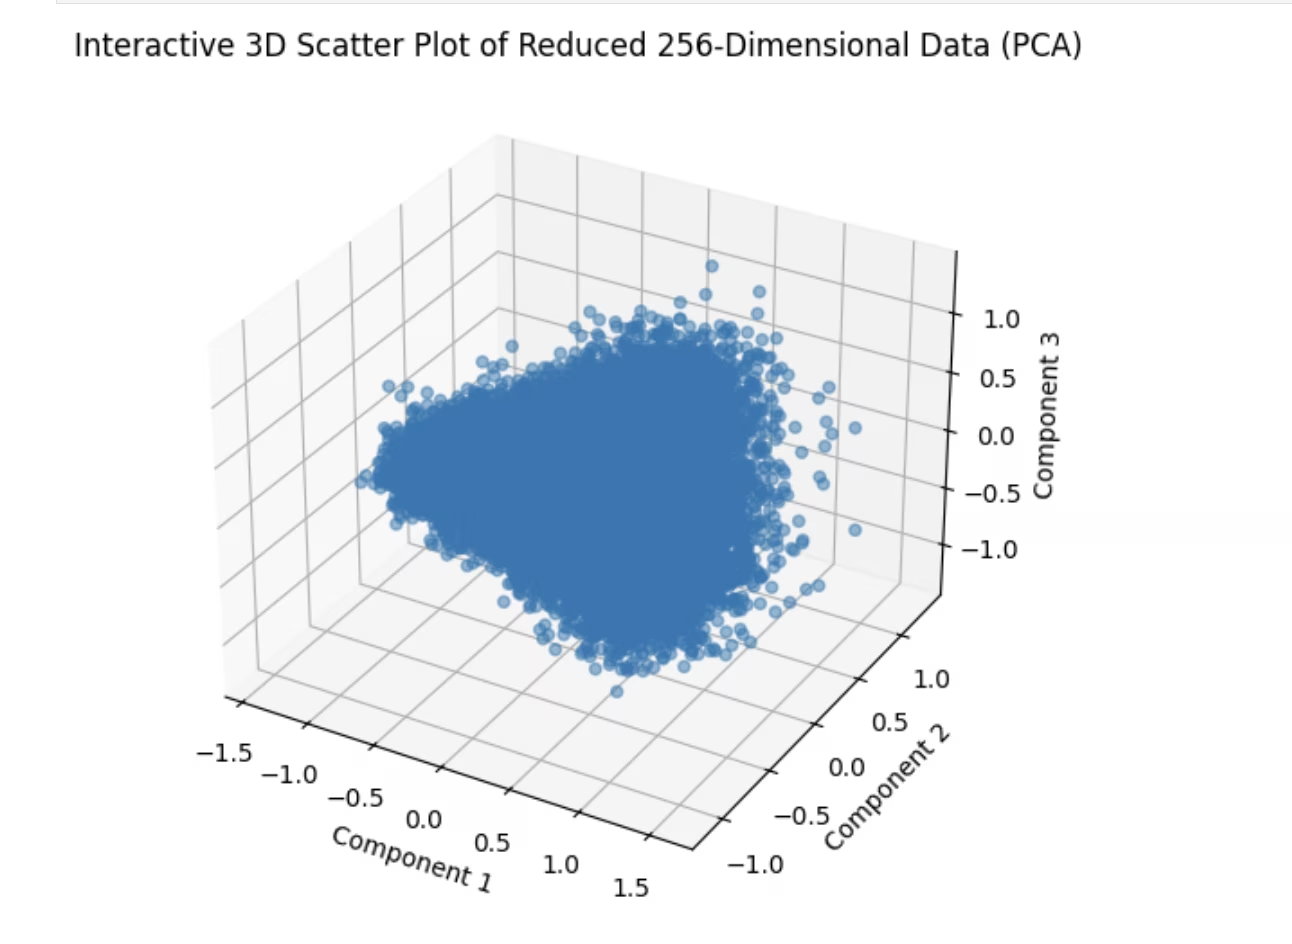
One of the preliminary steps in analyzing embeddings is by plotting them in 2D space via dimensionality reduction. Let's try an example
|
||
|
|
|
||
|
|
|
||
|
|
|
||
|
|
```python
|
||
|
|
import matplotlib.pyplot as plt
|
||
|
|
from sklearn.decomposition import PCA # pip install scikit-learn
|
||
|
|
|
||
|
|
# Reduce dimensions using PCA to 3 components for visualization in 3D
|
||
|
|
pca = PCA(n_components=3)
|
||
|
|
reduced_data = pca.fit_transform(embeddings)
|
||
|
|
|
||
|
|
# Create a 3D scatter plot using Matplotlib's Axes3D
|
||
|
|
fig = plt.figure(figsize=(8, 6))
|
||
|
|
ax = fig.add_subplot(111, projection="3d")
|
||
|
|
|
||
|
|
# Scatter plot
|
||
|
|
ax.scatter(reduced_data[:, 0], reduced_data[:, 1], reduced_data[:, 2], alpha=0.5)
|
||
|
|
ax.set_title("3D Scatter Plot of Reduced 256-Dimensional Data (PCA)")
|
||
|
|
ax.set_xlabel("Component 1")
|
||
|
|
ax.set_ylabel("Component 2")
|
||
|
|
ax.set_zlabel("Component 3")
|
||
|
|
|
||
|
|
plt.show()
|
||
|
|
```
|
||
|
|
|
||
|
|
### Similarity Index
|
||
|
|
|
||
|
|
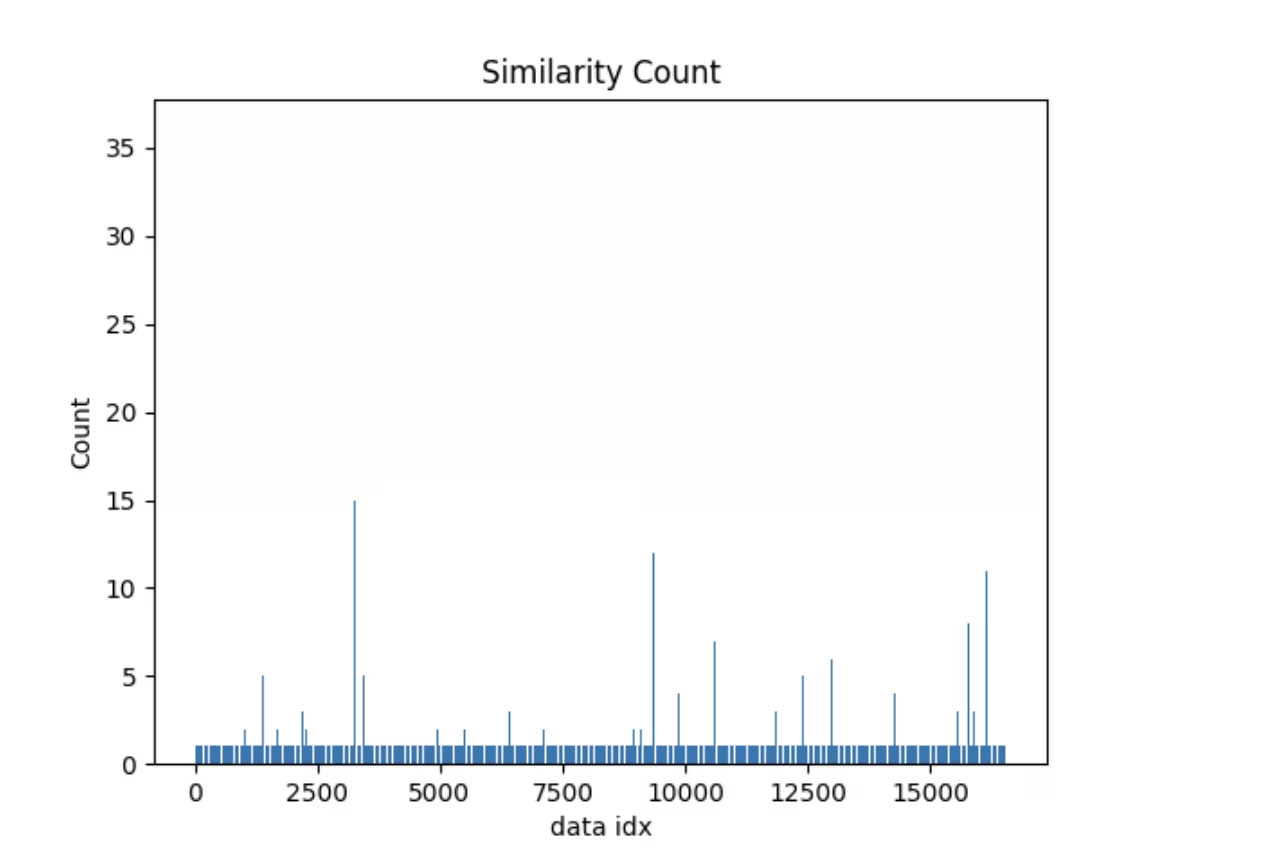
Here's a simple example of an operation powered by the embeddings table. Explorer comes with a `similarity_index` operation-
|
||
|
|
|
||
|
|
- It tries to estimate how similar each data point is with the rest of the dataset.
|
||
|
|
- It does that by counting how many image embeddings lie closer than max_dist to the current image in the generated embedding space, considering top_k similar images at a time.
|
||
|
|
|
||
|
|
For a given dataset, model, `max_dist` & `top_k` the similarity index once generated will be reused. In case, your dataset has changed, or you simply need to regenerate the similarity index, you can pass `force=True`. Similar to vector and SQL search, this also comes with a util to directly plot it.
|
||
|
|
|
||
|
|
```python
|
||
|
|
sim_idx = exp.similarity_index(max_dist=0.2, top_k=0.01)
|
||
|
|
exp.plot_similarity_index(max_dist=0.2, top_k=0.01)
|
||
|
|
```
|
||
|
|
|
||
|
|
|
||
|
|
|
||
|
|
Let's look at the plot first
|
||
|
|
|
||
|
|
```python
|
||
|
|
exp.plot_similarity_index(max_dist=0.2, top_k=0.01)
|
||
|
|
```
|
||
|
|
|
||
|
|
Now let's look at the output of the operation
|
||
|
|
|
||
|
|
```python
|
||
|
|
sim_idx = exp.similarity_index(max_dist=0.2, top_k=0.01, force=False)
|
||
|
|
|
||
|
|
sim_idx
|
||
|
|
```
|
||
|
|
|
||
|
|
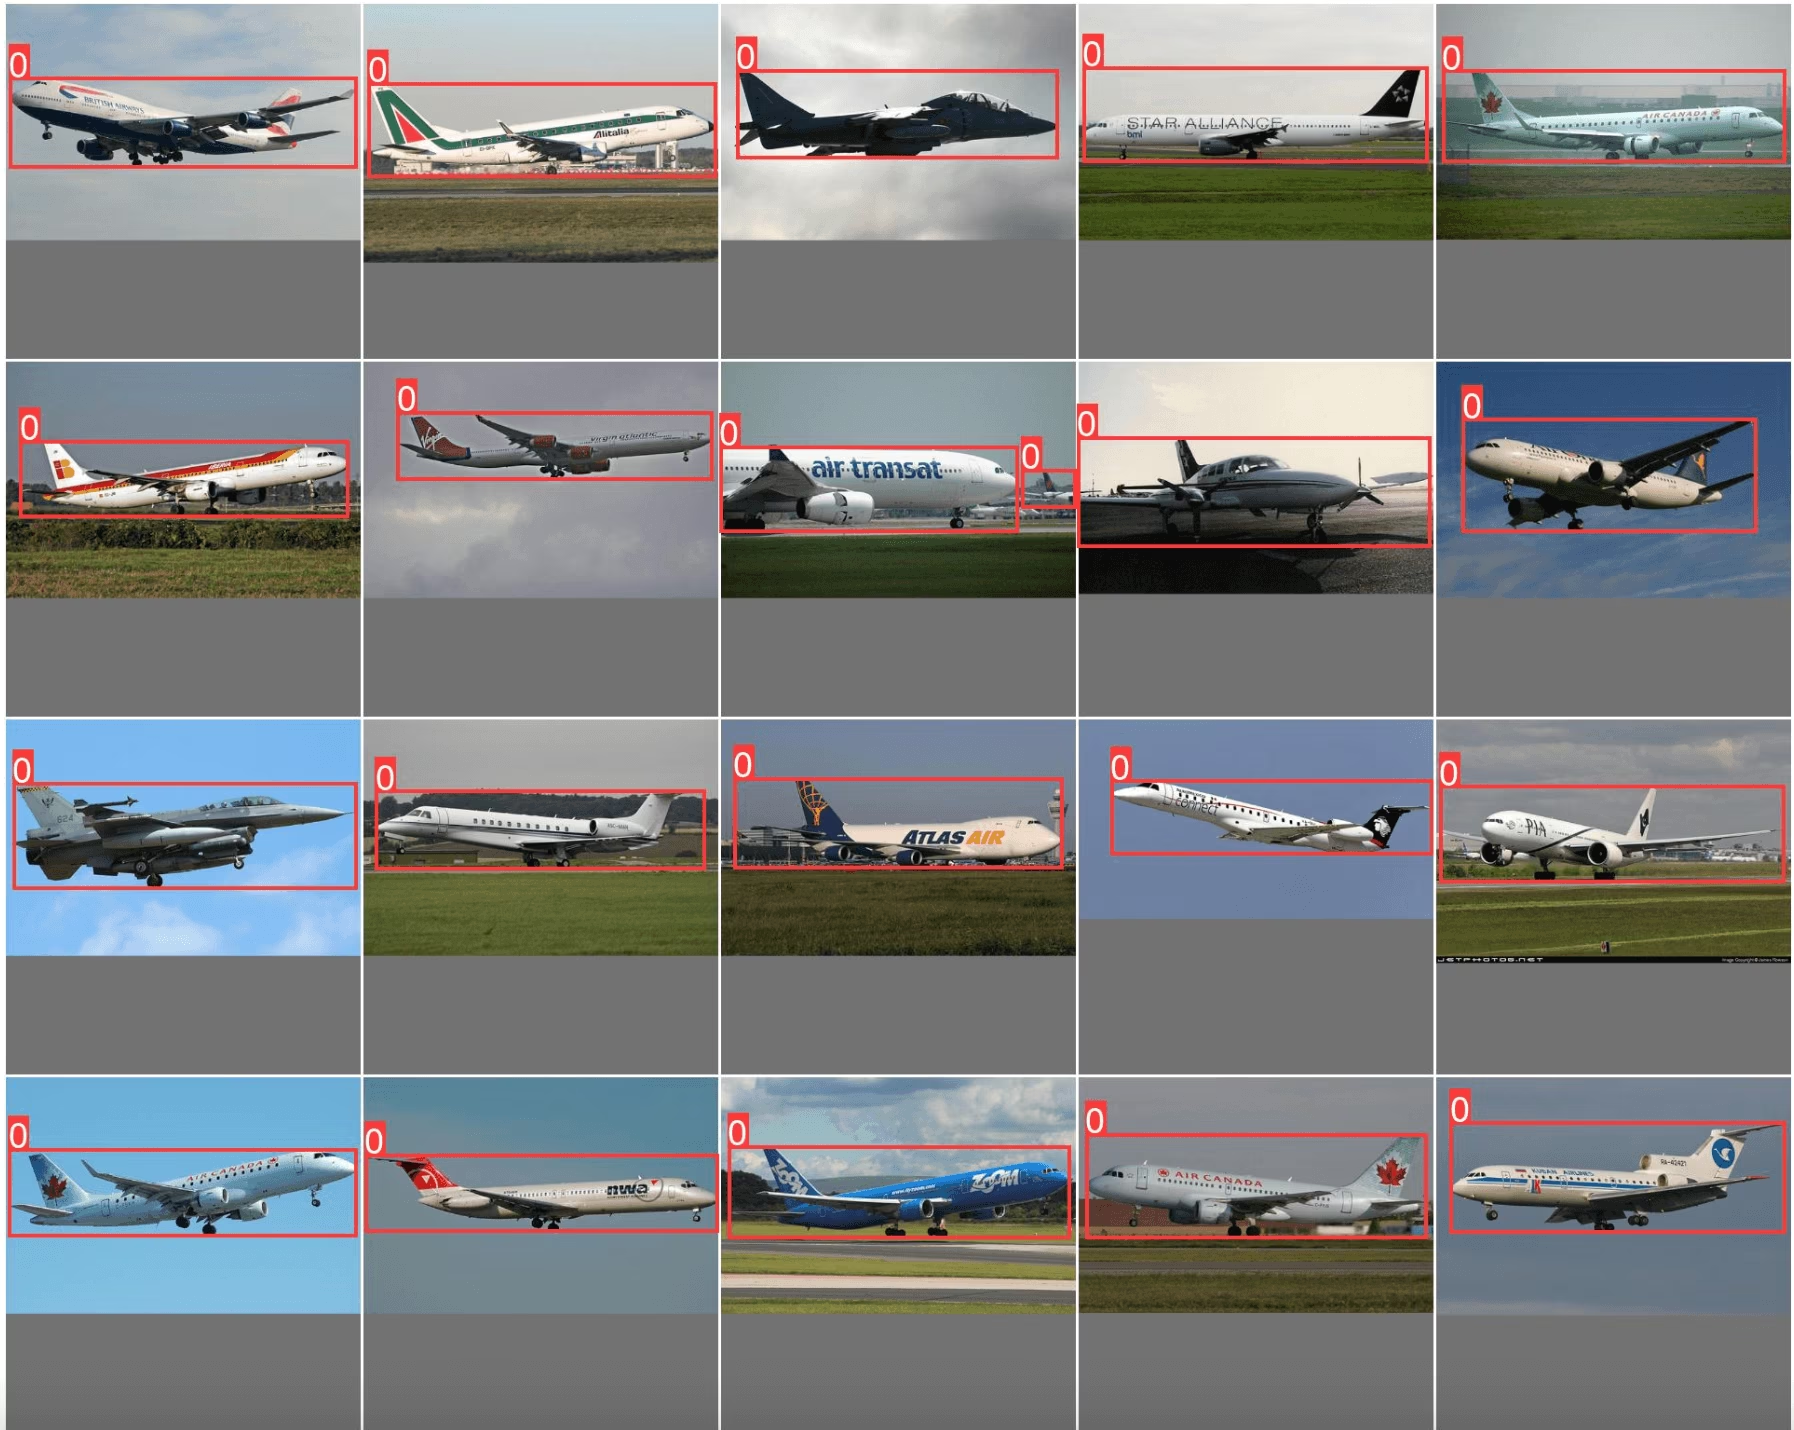
Let's create a query to see what data points have similarity count of more than 30 and plot images similar to them.
|
||
|
|
|
||
|
|
```python
|
||
|
|
import numpy as np
|
||
|
|
|
||
|
|
sim_count = np.array(sim_idx["count"])
|
||
|
|
sim_idx["im_file"][sim_count > 30]
|
||
|
|
```
|
||
|
|
|
||
|
|
You should see something like this
|
||
|
|
|
||
|
|
|
||
|
|
|
||
|
|
```python
|
||
|
|
exp.plot_similar(idx=[7146, 14035]) # Using avg embeddings of 2 images
|
||
|
|
```
|